I use JWST NIRCAM catalogs of the Galactic Center for my research. These catalogs contain extremely high quality photometric data of tens of thousands of stars detected in the region around Sagittarius A*.
At the time of writing, I have access to photometry-calibrated catalogs for the F115W, F212N, and F323N GC catalogs. The name F115W refers to the catalog of stars taken in from a $1.15µm$ infrared wavelength. F212N is therefore the catalog of stars detected from a $2.12µm$ wavelength, commonly refered to as the $Ks$ infrared band.
Newer, better, and deeper catalogs are always coming in however. The F115W, F212N, and F323N catalogs I currently am working with have the following sizes:
| Region | F115W | F212N | F323N |
|---|---|---|---|
| NRCB1 | 53620 | 121349 | \ |
| NRCB2 | 39326 | 115254 | \ |
| NRCB3 | 38482 | 115353 | \ |
| NRCB4 | 44077 | 119177 | \ |
| NRCB5 | \ | \ | 145122 |
The NRCB1-NRCB5 Region Labels indicate the NIRCAM detector on JWST that captured the respective catalogs. In other words, it labels which region of the GC correspond to the star catalogs, although of course there is major overlap.
Each catalog is taken as a .fits file that
contains the following columns of data for each star in the catalog:
| name | x | y | m | xe | ye | me | ndet | t |
|---|---|---|---|---|---|---|---|---|
| b’NRCB5_1' | 22.375941 | 3.794375 | -4.905596 | 0.070170 | 0.166955 | 0.155713 | 12 | 2022.71676 |
| b’NRCB5_2' | 124.919375 | 4.338255 | -4.154696 | 0.028929 | 0.038685 | 0.056939 | 12 | 2022.71676 |
| b’NRCB5_3' | 146.236701 | 3.885486 | -4.607952 | 0.019055 | 0.055767 | 0.033773 | 12 | 2022.71676 |
| $\vdots$ | $\vdots$ | $\vdots$ | $\vdots$ | $\vdots$ | $\vdots$ | $\vdots$ | $\vdots$ | $\vdots$ |
| — | — | — | — | — | – | — | — | — |
Snippet of NRCB5 JWST Catalog
The only columns of importance are the x, y, m and their respective
errors xe, ye, me. These columns exist for all the catalogs. Let us first
see what these catalogs actually look like – what the JWST images of the Galactic
Center look like.
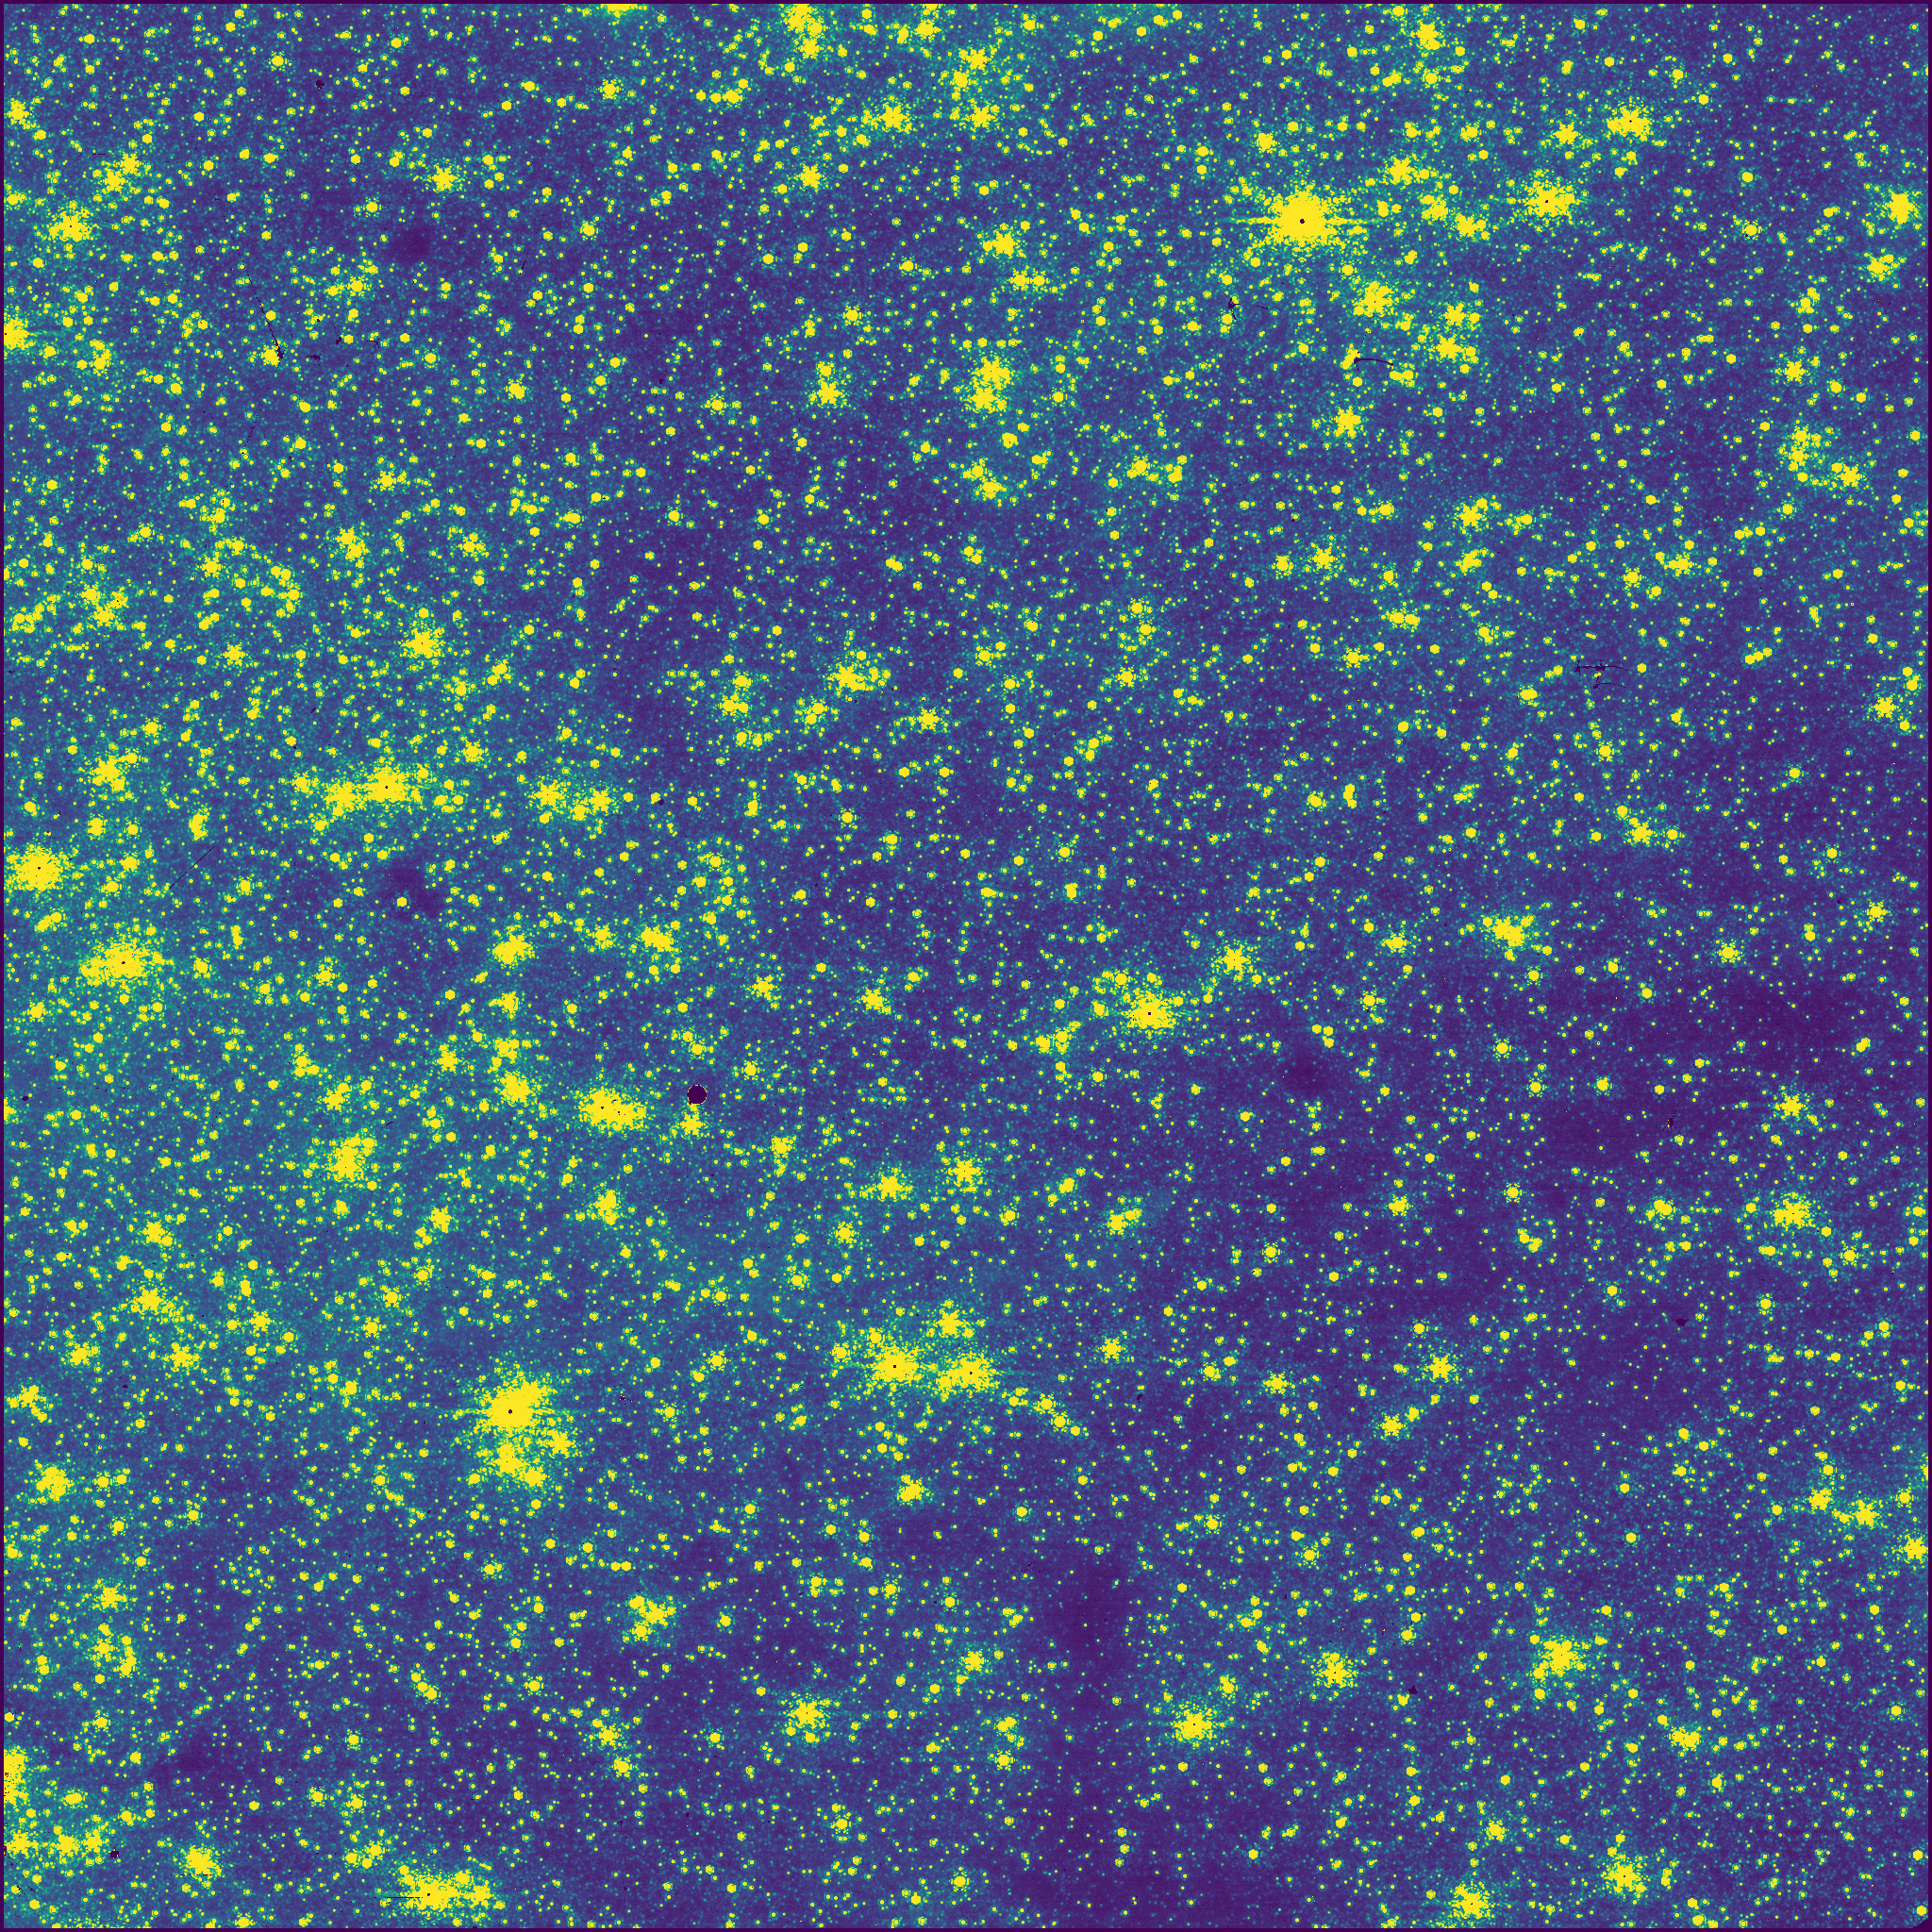 F212N NRCB1 Image
If we plot the x and y star positions for every star in the NRCB1 F212N
we should see something similar…
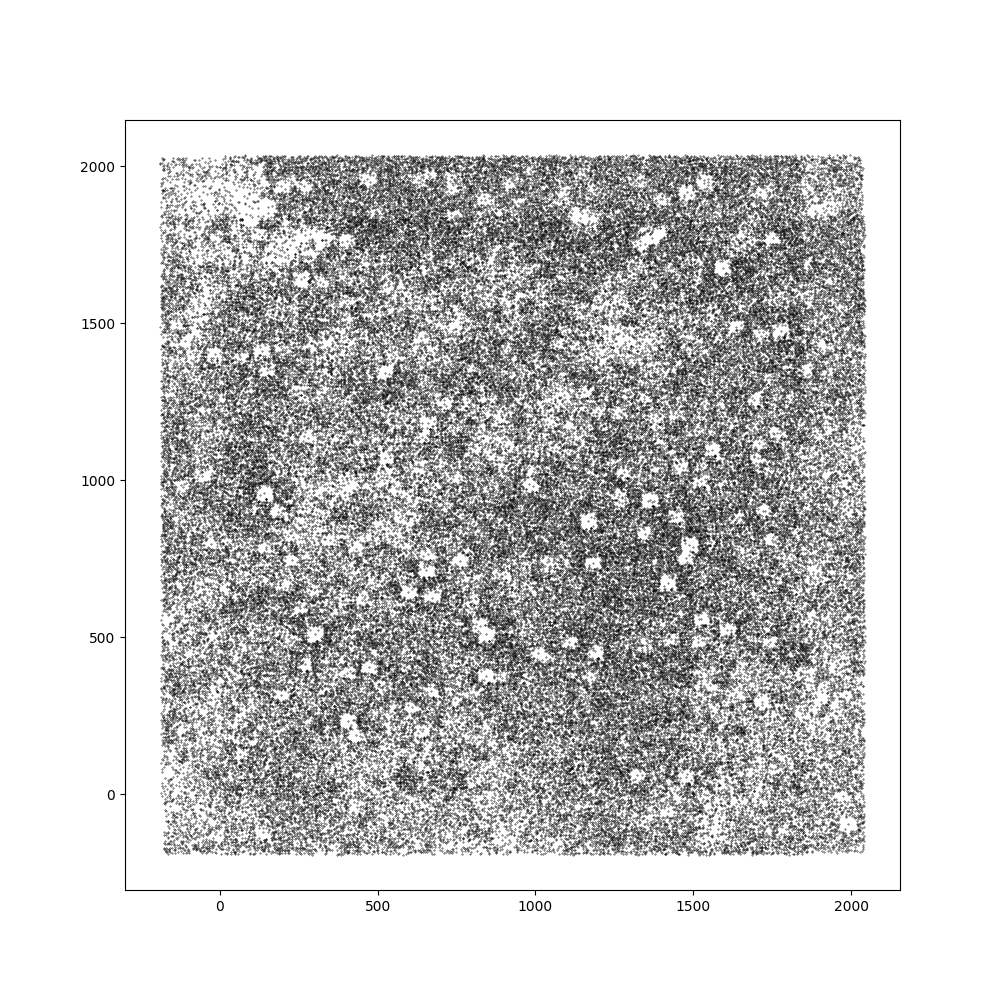 F212N NRCB1 $(x, y)$ centroid coordinates
ehhh I don’t really see it, maybe if I overplot the two and look closely?

Here each miniscule green circle represents a star the catalog contains. If you look closely it actually matches really well! Almost every star in the zoomed image has a green circle overlaying it. This is true for all the F115W, F212N, and F323N catalogs I work with. We are now able to perform some data analysis and work with these catalogs. The first task is to generate the relevant color-magnitude diagrams.